Back to the work

Case notes · Web app

EbbAndFlow

A private period tracker I built for my wife. It learns her real cycle from what she logs and predicts the next one, honestly. No paywall, no ads, no account but hers.

Next.js · Supabase · Vercel · Live and in daily use · Screenshots show sample data

Why it exists

My wife tracked her cycle in one of the big period apps, and the app kept asking to be paid. Predictions behind a subscription, past cycles behind a subscription, then one day the feature she actually used moved behind it too.

Cycle data is also not the kind of data you want in an ad-funded app. So I built her one: private by construction, one user, her data in a database she can ask me about over dinner.

The product goal was narrower and warmer than the apps it replaced: a calm daily check-in, a calendar that shows what is coming, and predictions that admit what they do not know.
The app on her phone

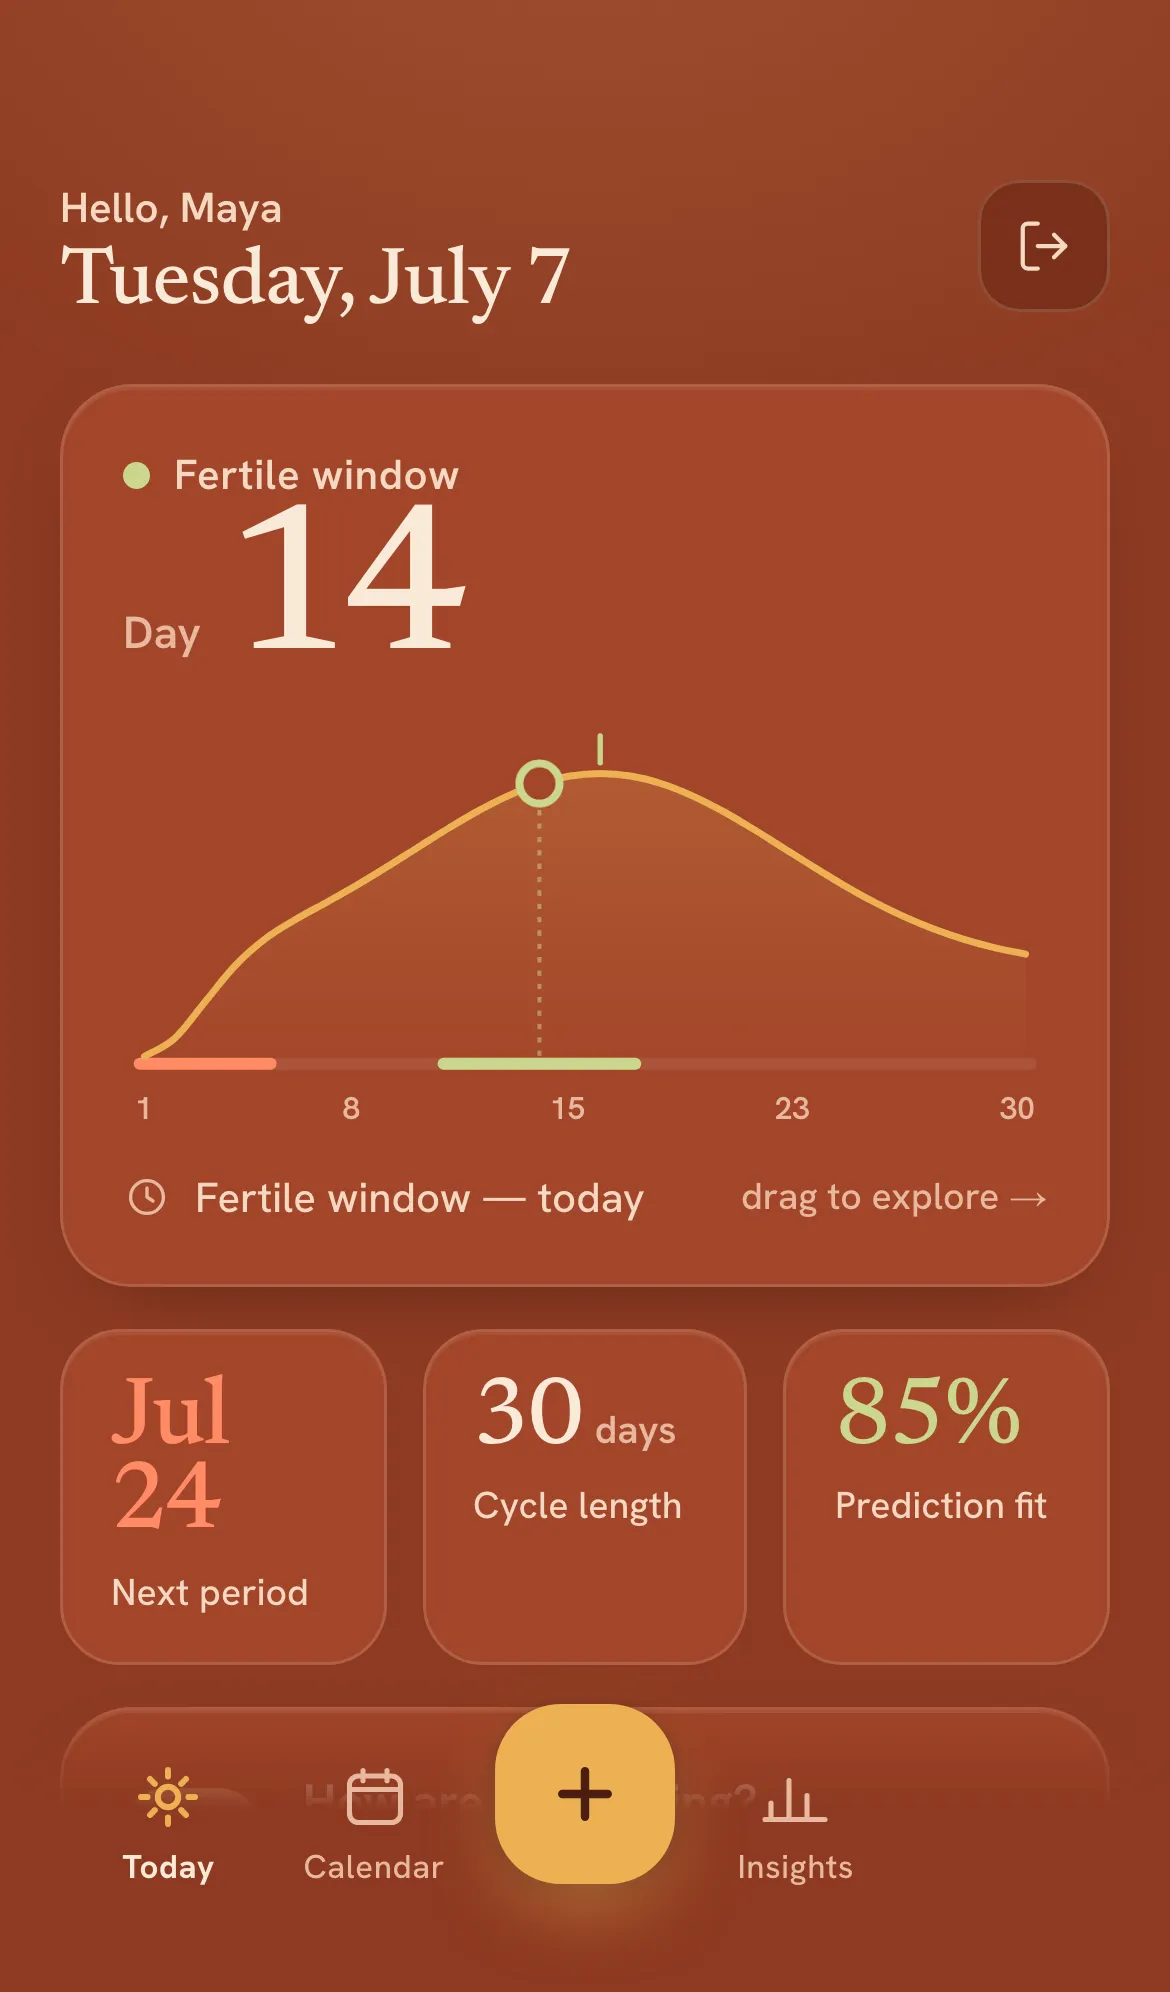
EbbAndFlow today screen with cycle day, phase curve, next period prediction, and prediction fit, sample data

Today, at a glance

The screen she opens most: which cycle day it is, which phase, and when the next period is due. The three numbers under the curve are all derived from her own logs, not from a textbook cycle, and the prediction fit says how much to trust them.

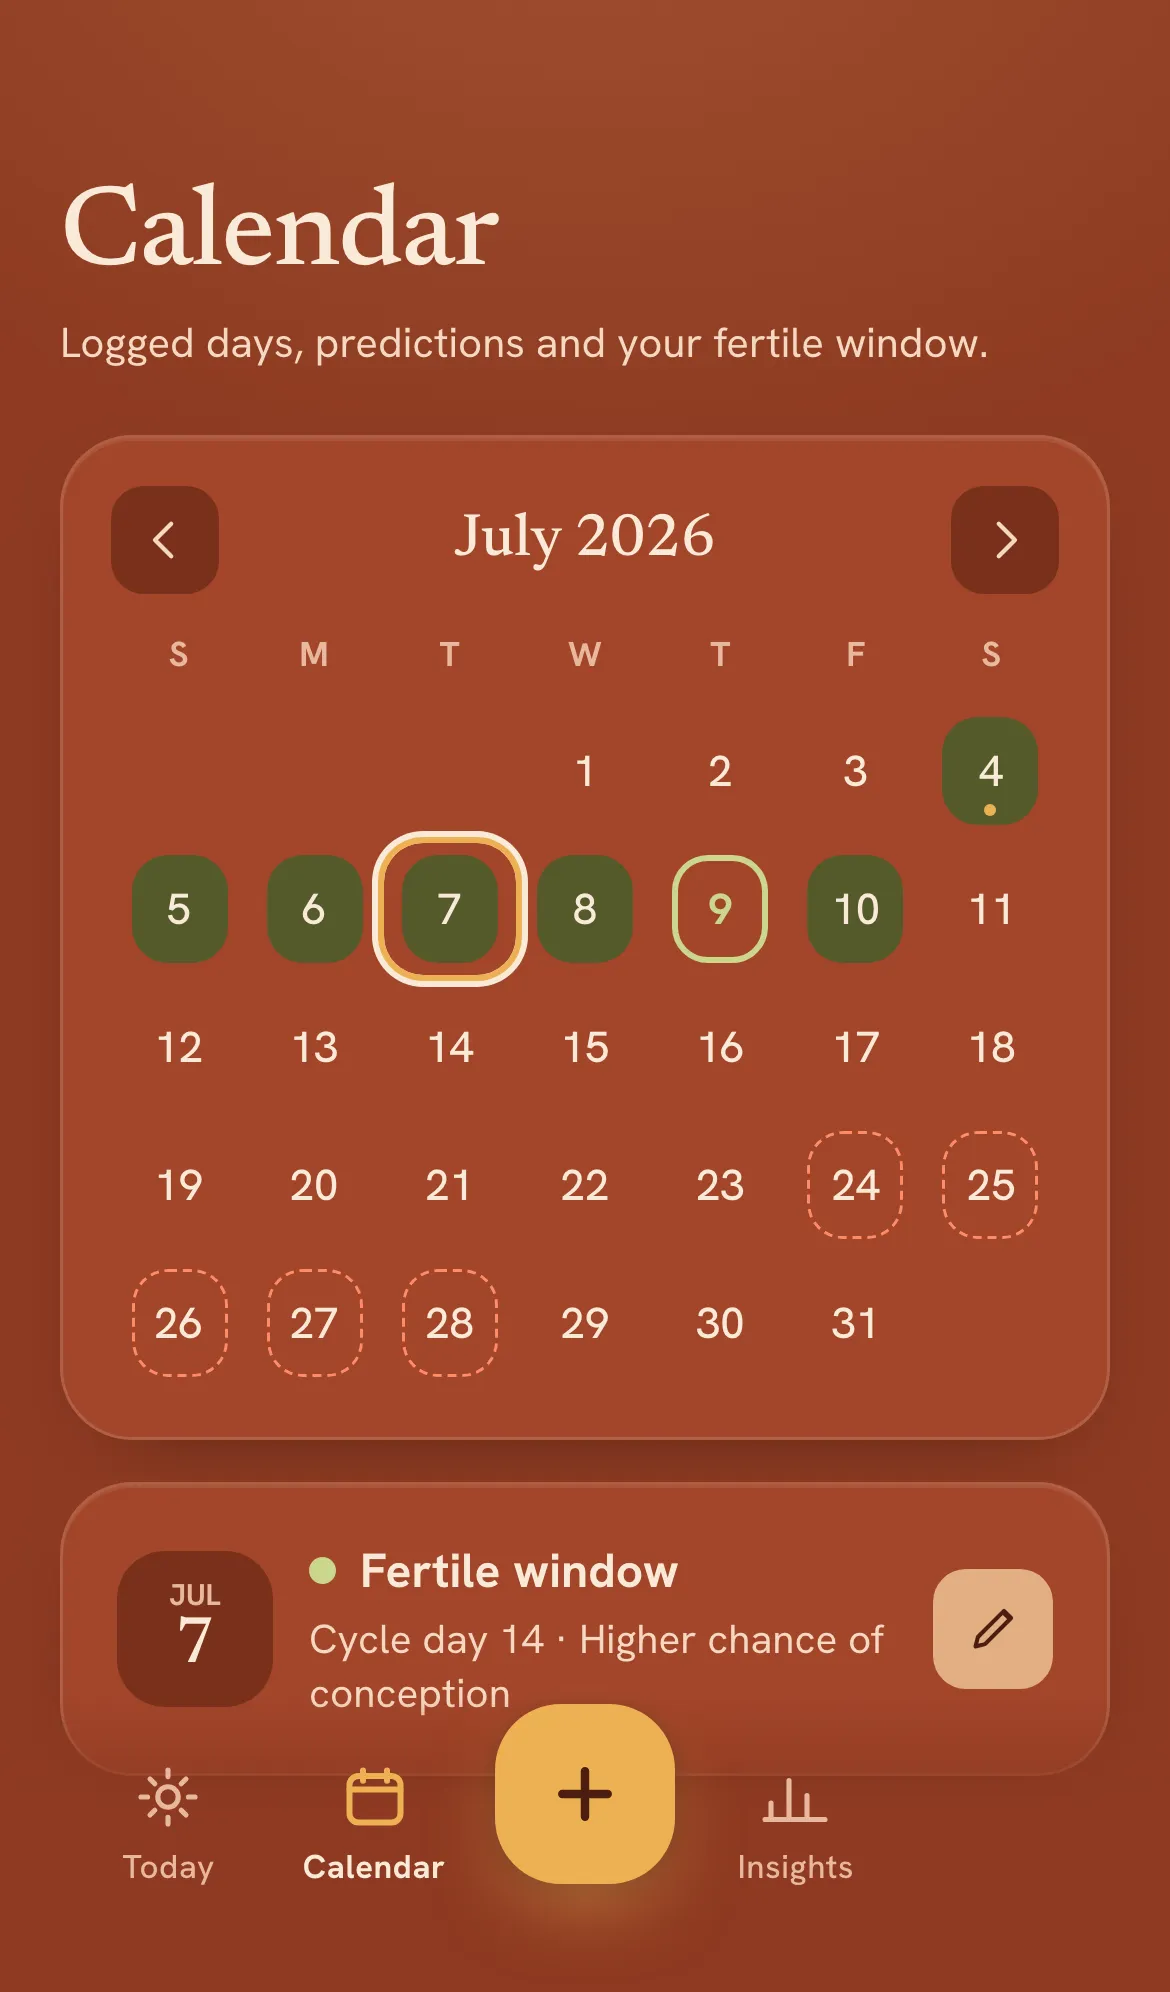
EbbAndFlow calendar with logged period days, predicted period days as dashed outlines, and the fertile window, sample data

A calendar that separates fact from forecast

Logged period days are solid, predicted ones are dashed outlines, and the fertile window is drawn with its own color and a label. What happened and what is expected never look the same, and no meaning rides on color alone.

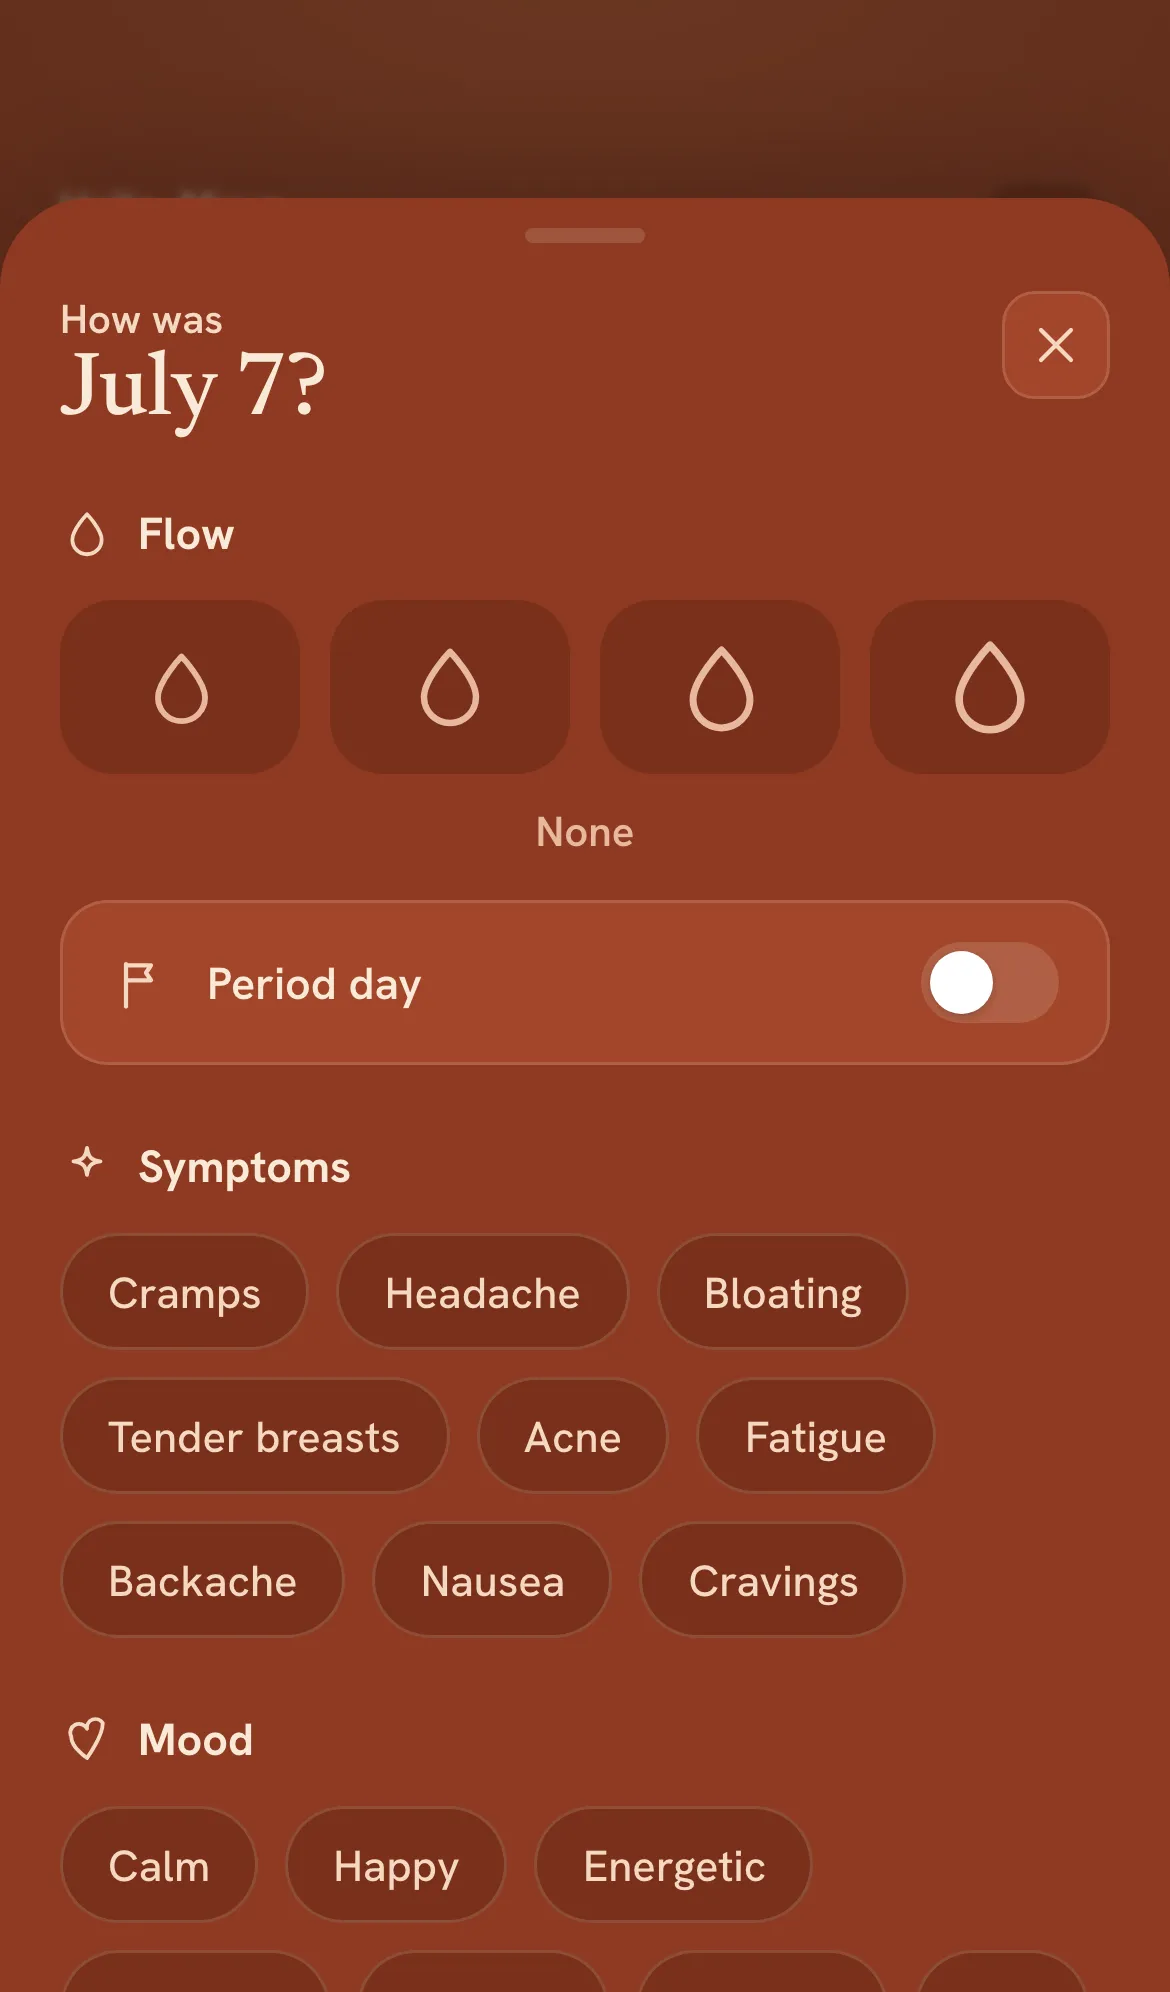
EbbAndFlow log sheet with flow picker, period day toggle, symptom chips, and mood chips, sample data

Logging as a quiet ritual

One sheet for the daily check-in, usually in bed at night: flow on a four-drop scale, a period-day toggle, symptoms, and mood. One tap per fact, and the day is captured; the model recomputes from it immediately.

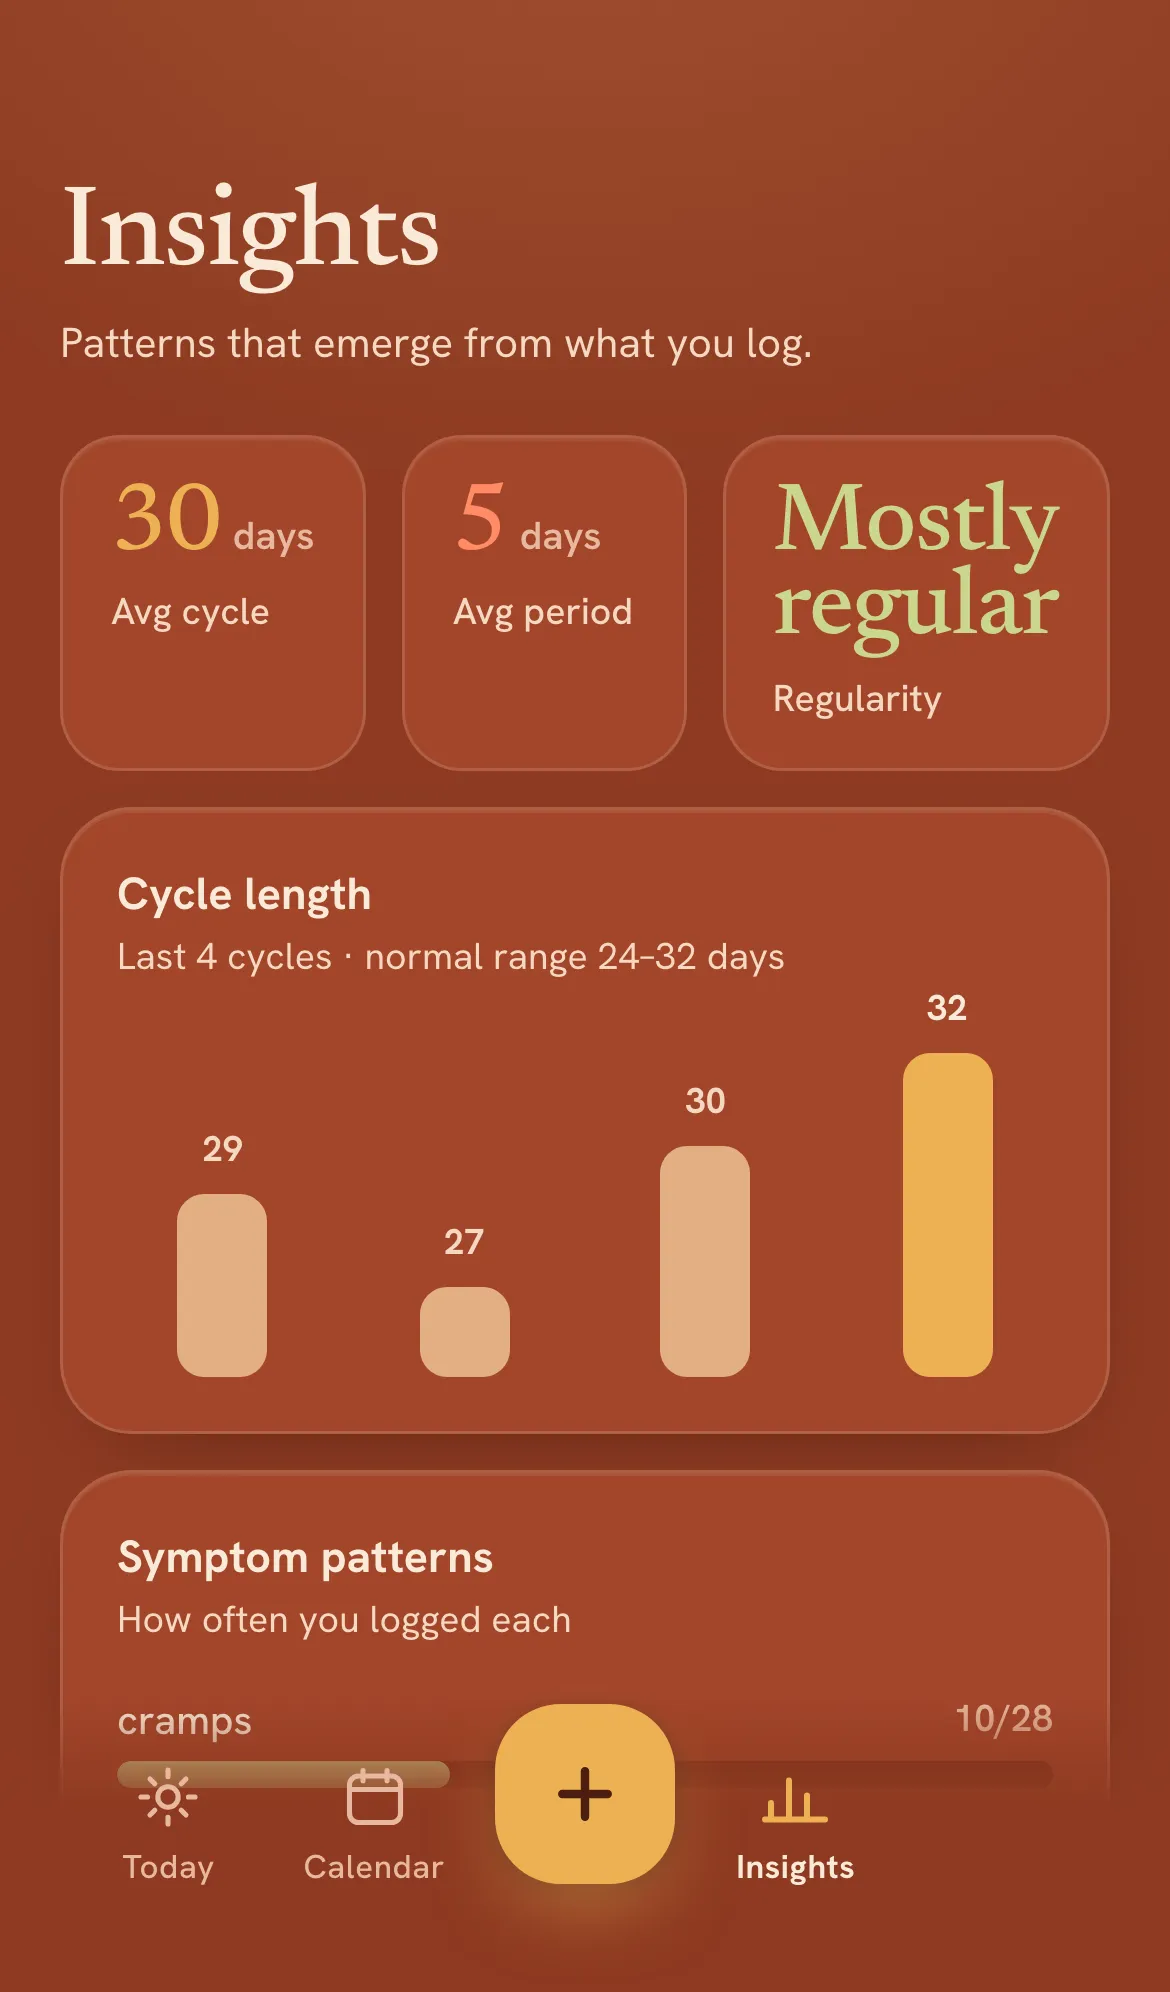
EbbAndFlow insights screen with average cycle, average period, regularity, and cycle length chart, sample data

Insights that admit their sample size

Average cycle, average period, and a regularity verdict, with the last cycles charted so she can see the spread behind the average. The app says "mostly regular" when that is what the data shows, instead of a precise-sounding number it cannot back.

The hard parts

Learning the cycle instead of assuming it

Most trackers project from a textbook 28-day cycle. ebb derives cycle and period length from the gaps between logged period starts, anchors on the most recent one, and recomputes every projection as new logs arrive. The model is a pure function from logs to predictions, so it is testable and has no state to drift.

Honest confidence

The app reports how regular the logged cycles actually are and how well past predictions fit, and it says plainly when it does not have enough data. It is a calendar estimate, not contraception, and the interface never pretends otherwise.

Private by construction

One user, row-level security on every table, no analytics, no third-party scripts. The signup trigger provisions the profile, and every query is scoped to the authenticated user at the database, not in application code.

Notes on the build

Next.js App Router with the data fetched on the server and a client shell for the three screens and the log sheet. Supabase provides auth and Postgres; row-level security scopes every table to the one signed-in user. Deployed on Vercel.

If you want to talk about this build, or something you want built, say hello on WhatsApp or write to philip.kamdani@gmail.com.

Back to the work