Back to the work

Case notes · Web app

StockDashboard

A trading journal for someone learning to trade: my spreadsheet's trade history made readable, tagged with my own behavior, and briefed on what the market did today.

Next.js · Supabase · Google Sheets · Live and in daily use · Screenshots show sample data

Why it exists

I am learning to trade, and the standard advice is to keep a journal. Mine started as a Google Sheet, and the sheet is good at exactly one thing: recording transactions. It cannot show a losing streak forming, cannot tell me my average loss is growing, and cannot connect December's stop-out to March's revenge entry on the same ticker.

The interesting problems in trading turned out to be behavioral, not analytical. I do not lose money because I cannot read a chart; I lose it when I chase a green candle the group chat is excited about. A journal that only records prices never catches that.

So the dashboard keeps the sheet as the system of record and builds the self-awareness layer on top: tags for how a trade actually happened, a written plan before each session, and a briefing that prepares tomorrow from what the market and the analysts I follow did today.

The sheet, made readable

The transaction log lives in a Google Sheet, and it stays there: the dashboard reads it, never writes it. Every sell row is one completed trade, and the app computes what the sheet cannot show, like how many days a position was actually held, by walking the buys and sells that opened and closed each lot.

The portfolio view merges that history with live prices, so cost, unrealized gain, realized gain, and dividends sit on one screen instead of five sheet tabs.
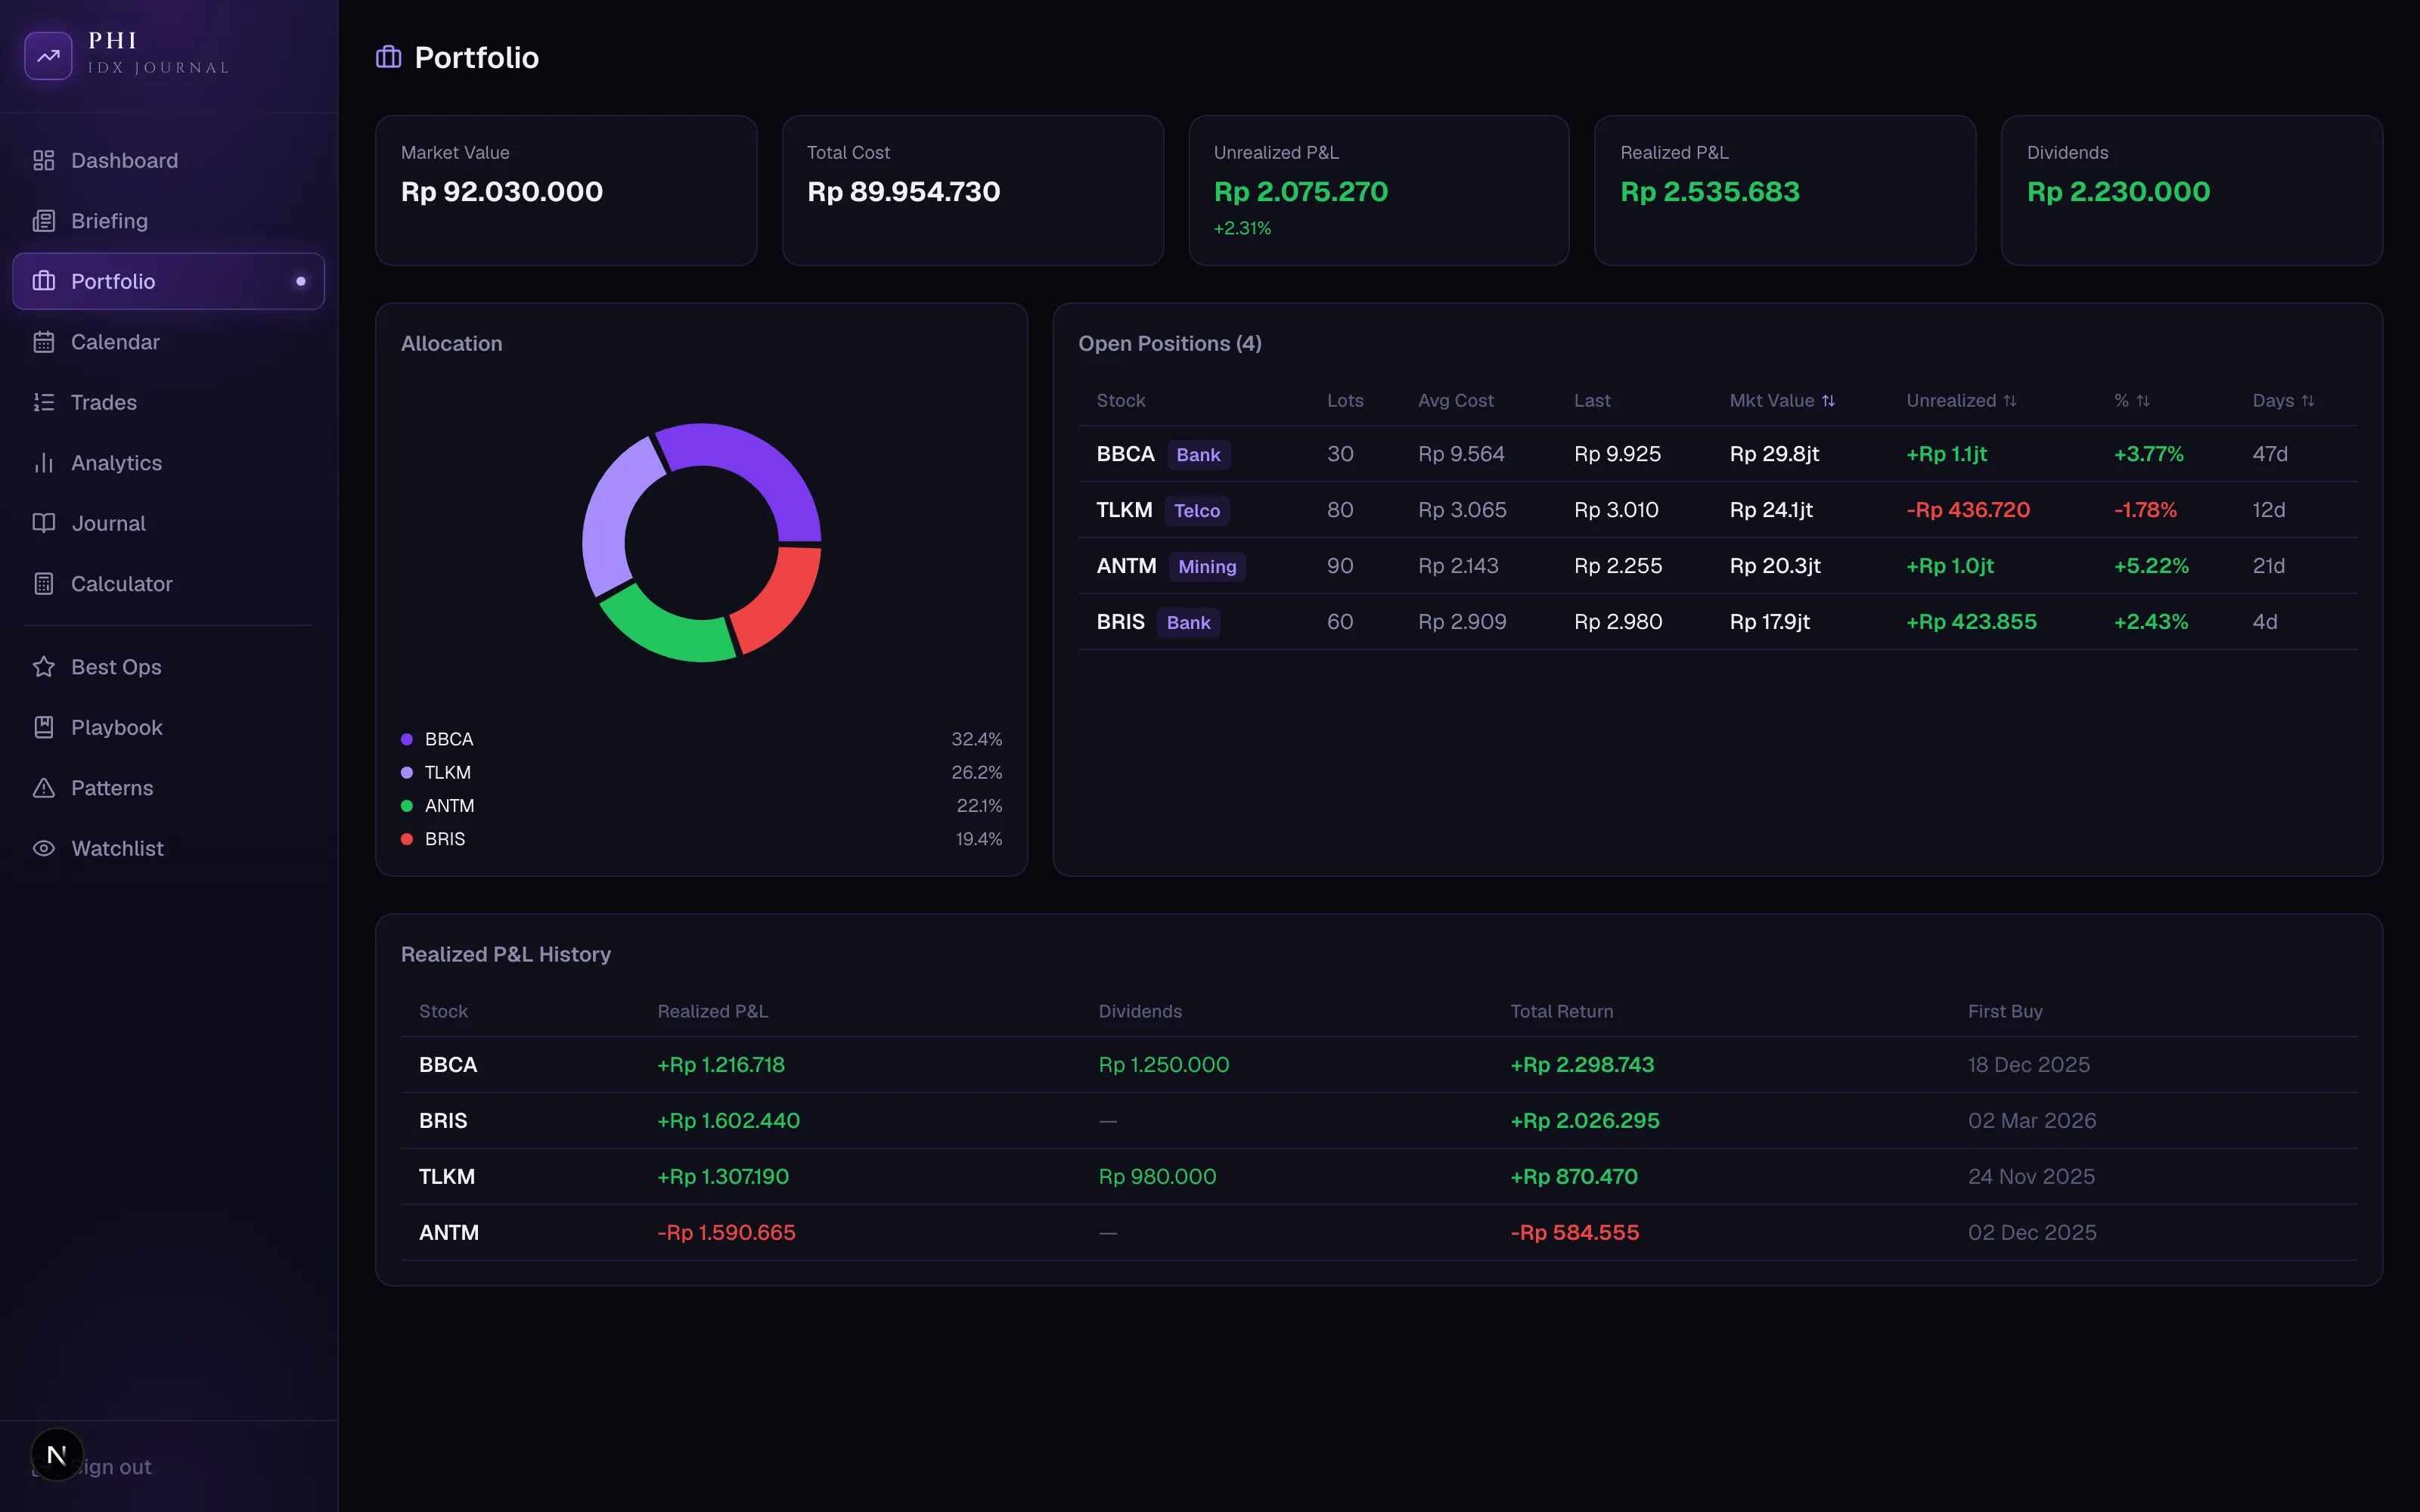
StockDashboard portfolio with allocation, open positions, and realized history, sample data
Portfolio: the sheet's history merged with live prices.

Trades that remember the plan

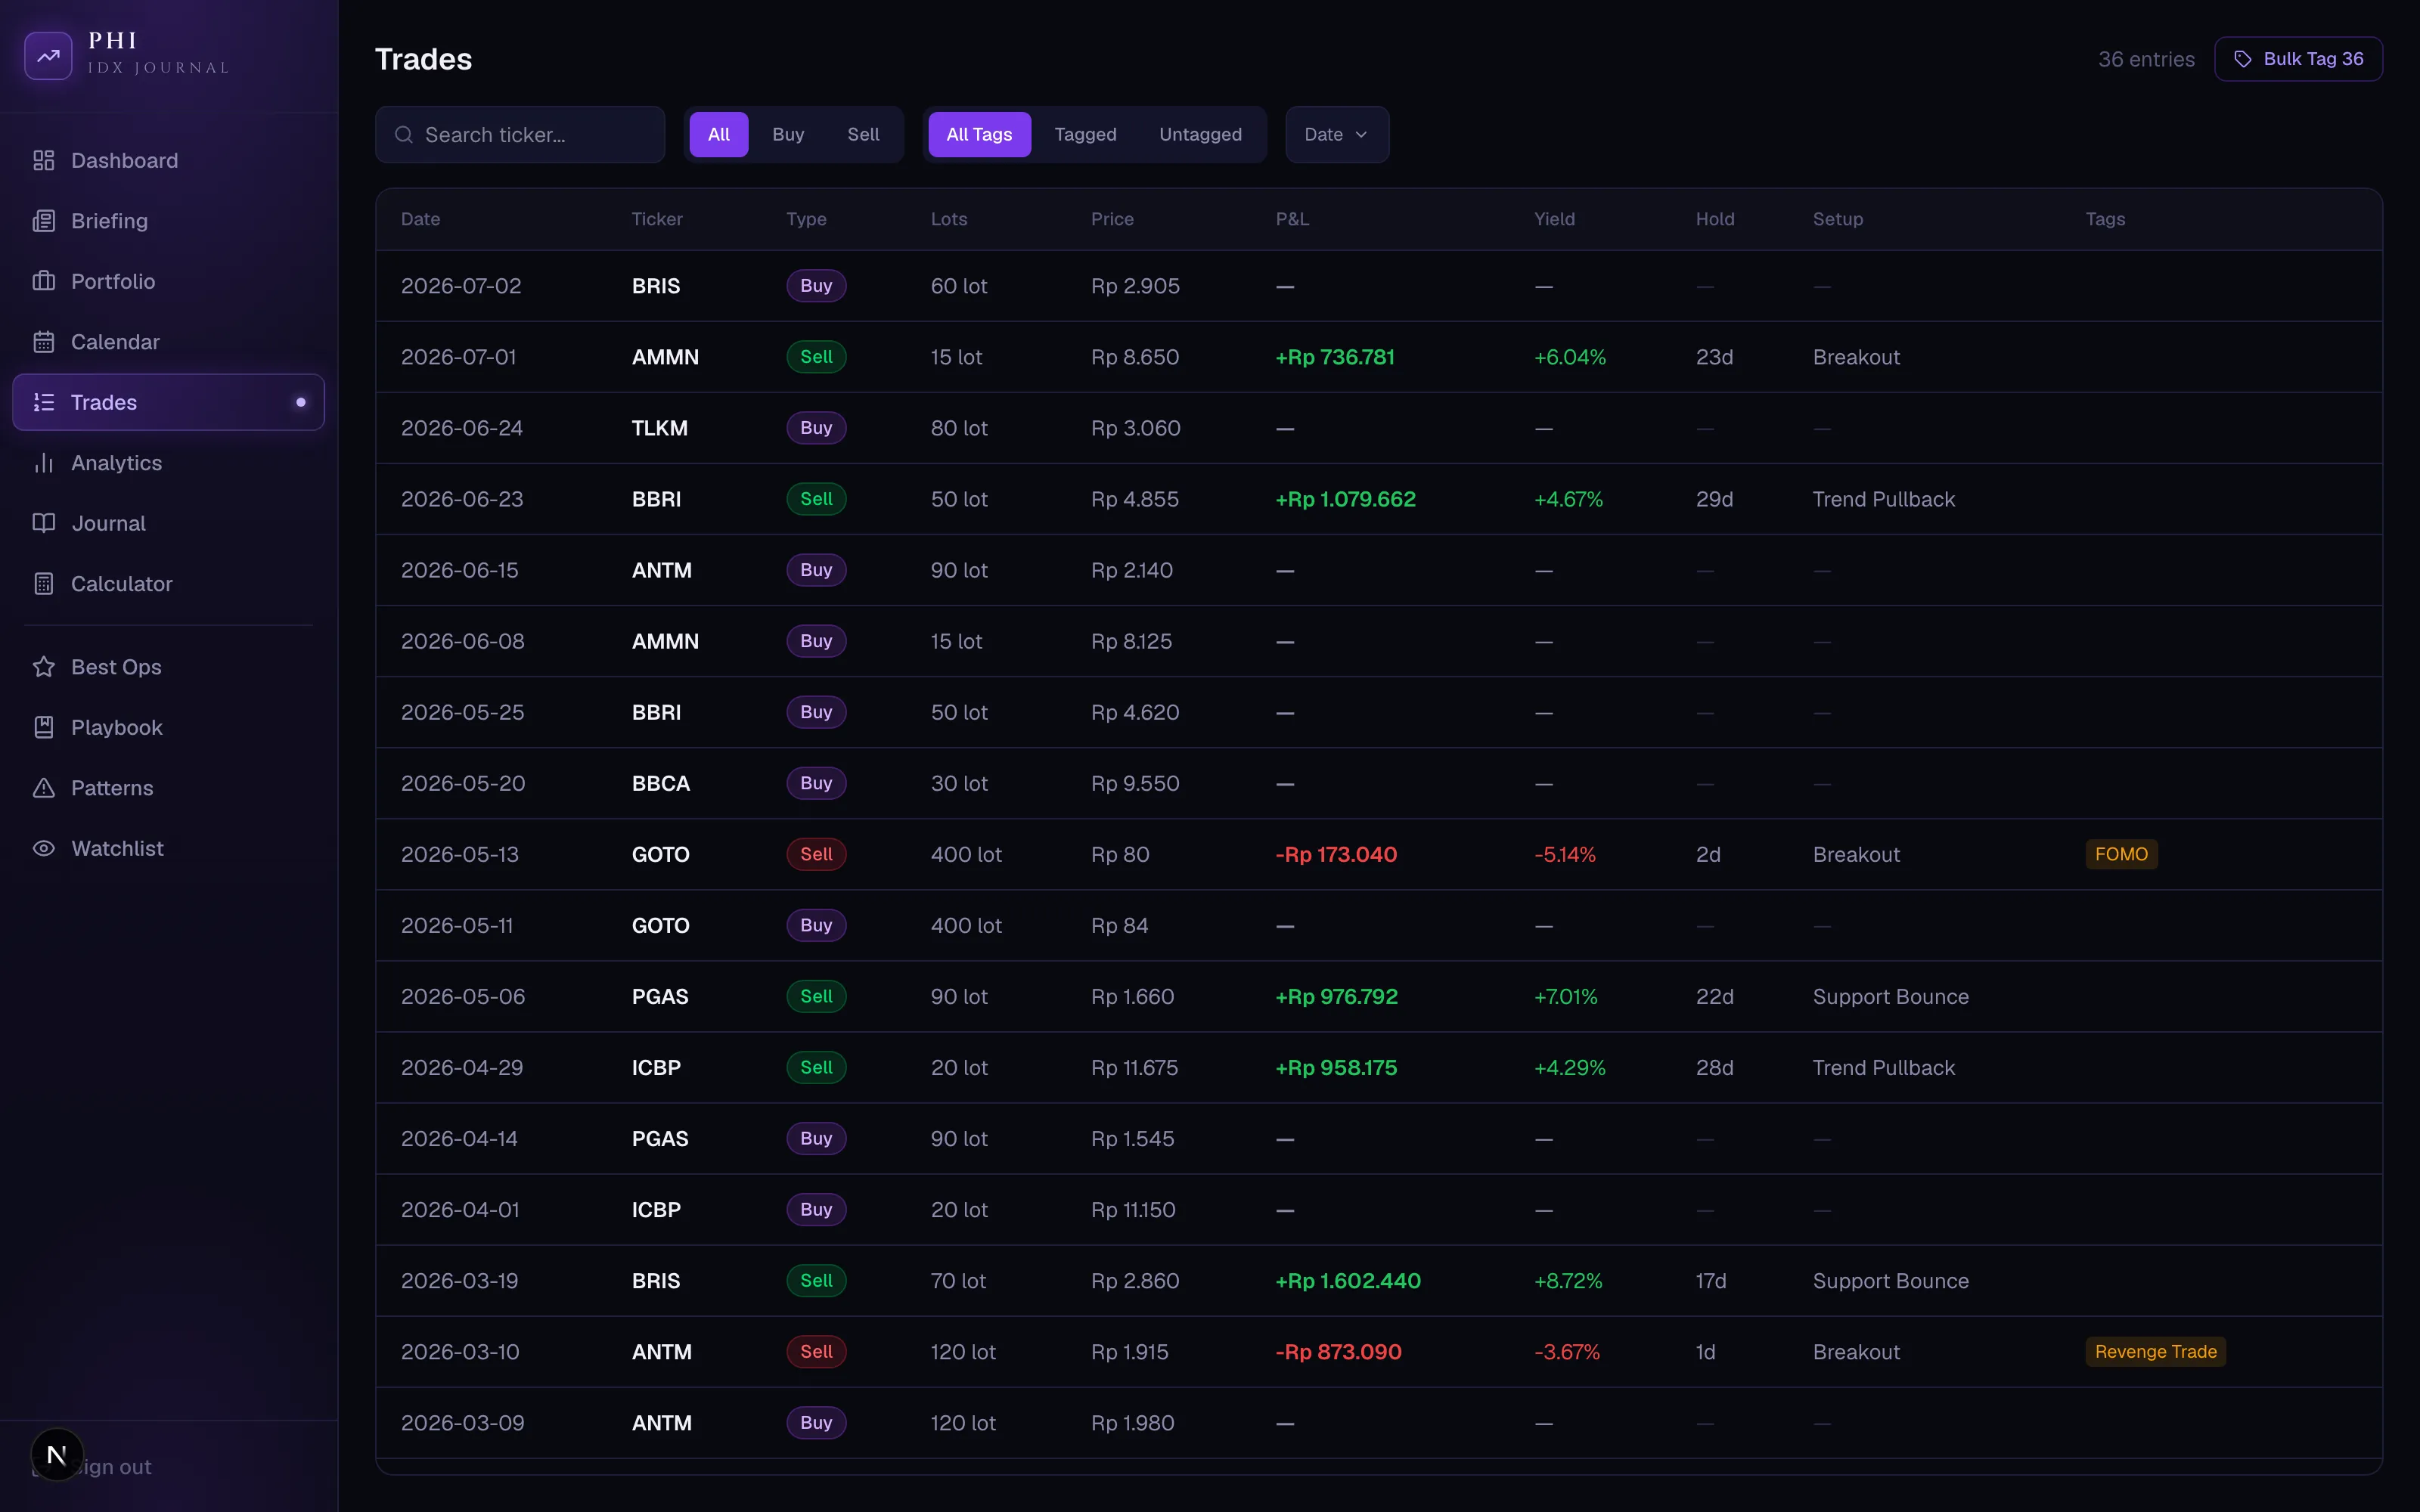
Each completed trade can be enriched: which playbook setup it was, the planned entry, stop, and target, and the emotion at the moment of entry. The enrichment lives in Supabase, keyed to the sheet row, so the sheet stays clean and the journal layer grows on top of it.

The tags in the last column are the honest ones: FOMO, Revenge Trade. They exist because the point of the journal is not tracking profit. It is catching myself.

StockDashboard trade log with setup and behavior tags, sample data
The trade log: every sell is a trade, and the tags say what really happened.

The numbers a learner actually needs

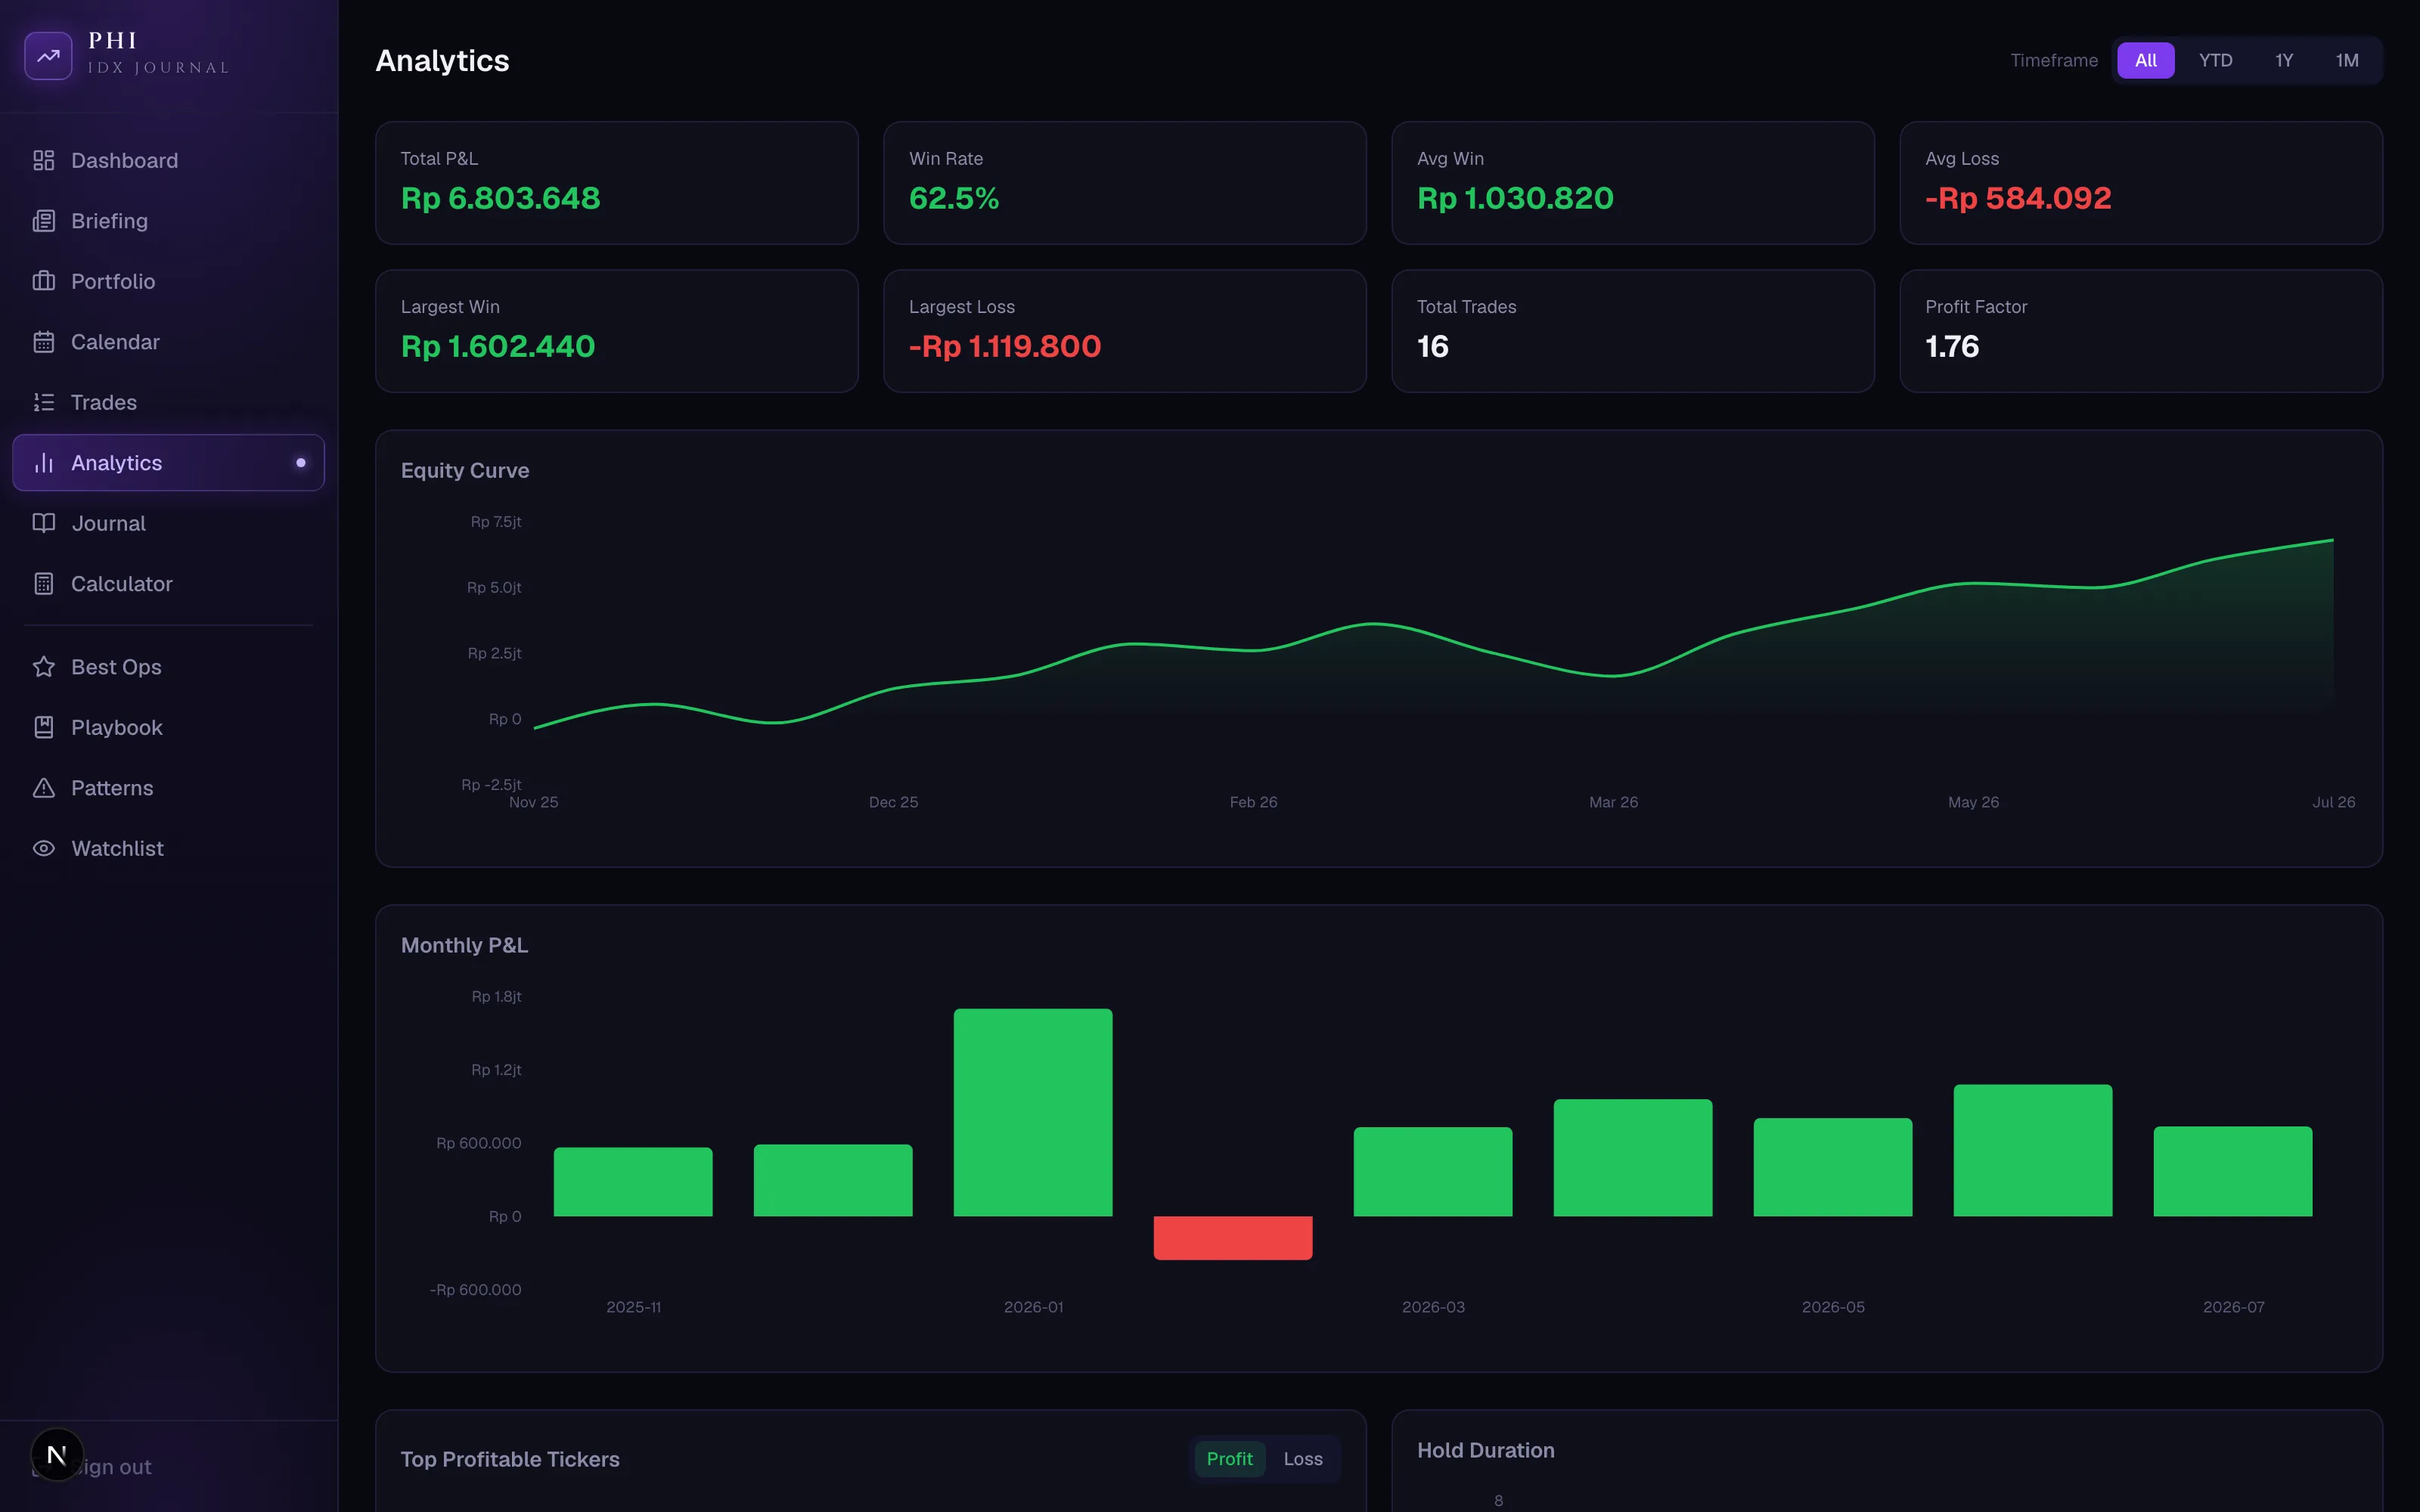
Win rate, average win against average loss, profit factor, and the equity curve. These are the numbers that tell a beginner whether the process is improving, which is a different question from whether this month made money.

Everything here is derived from the same sheet rows; there is no second bookkeeping to maintain or to drift.

StockDashboard analytics with win rate, profit factor, equity curve, and monthly P&L, sample data
Analytics: process metrics first, profit second.

A catalog of my own mistakes

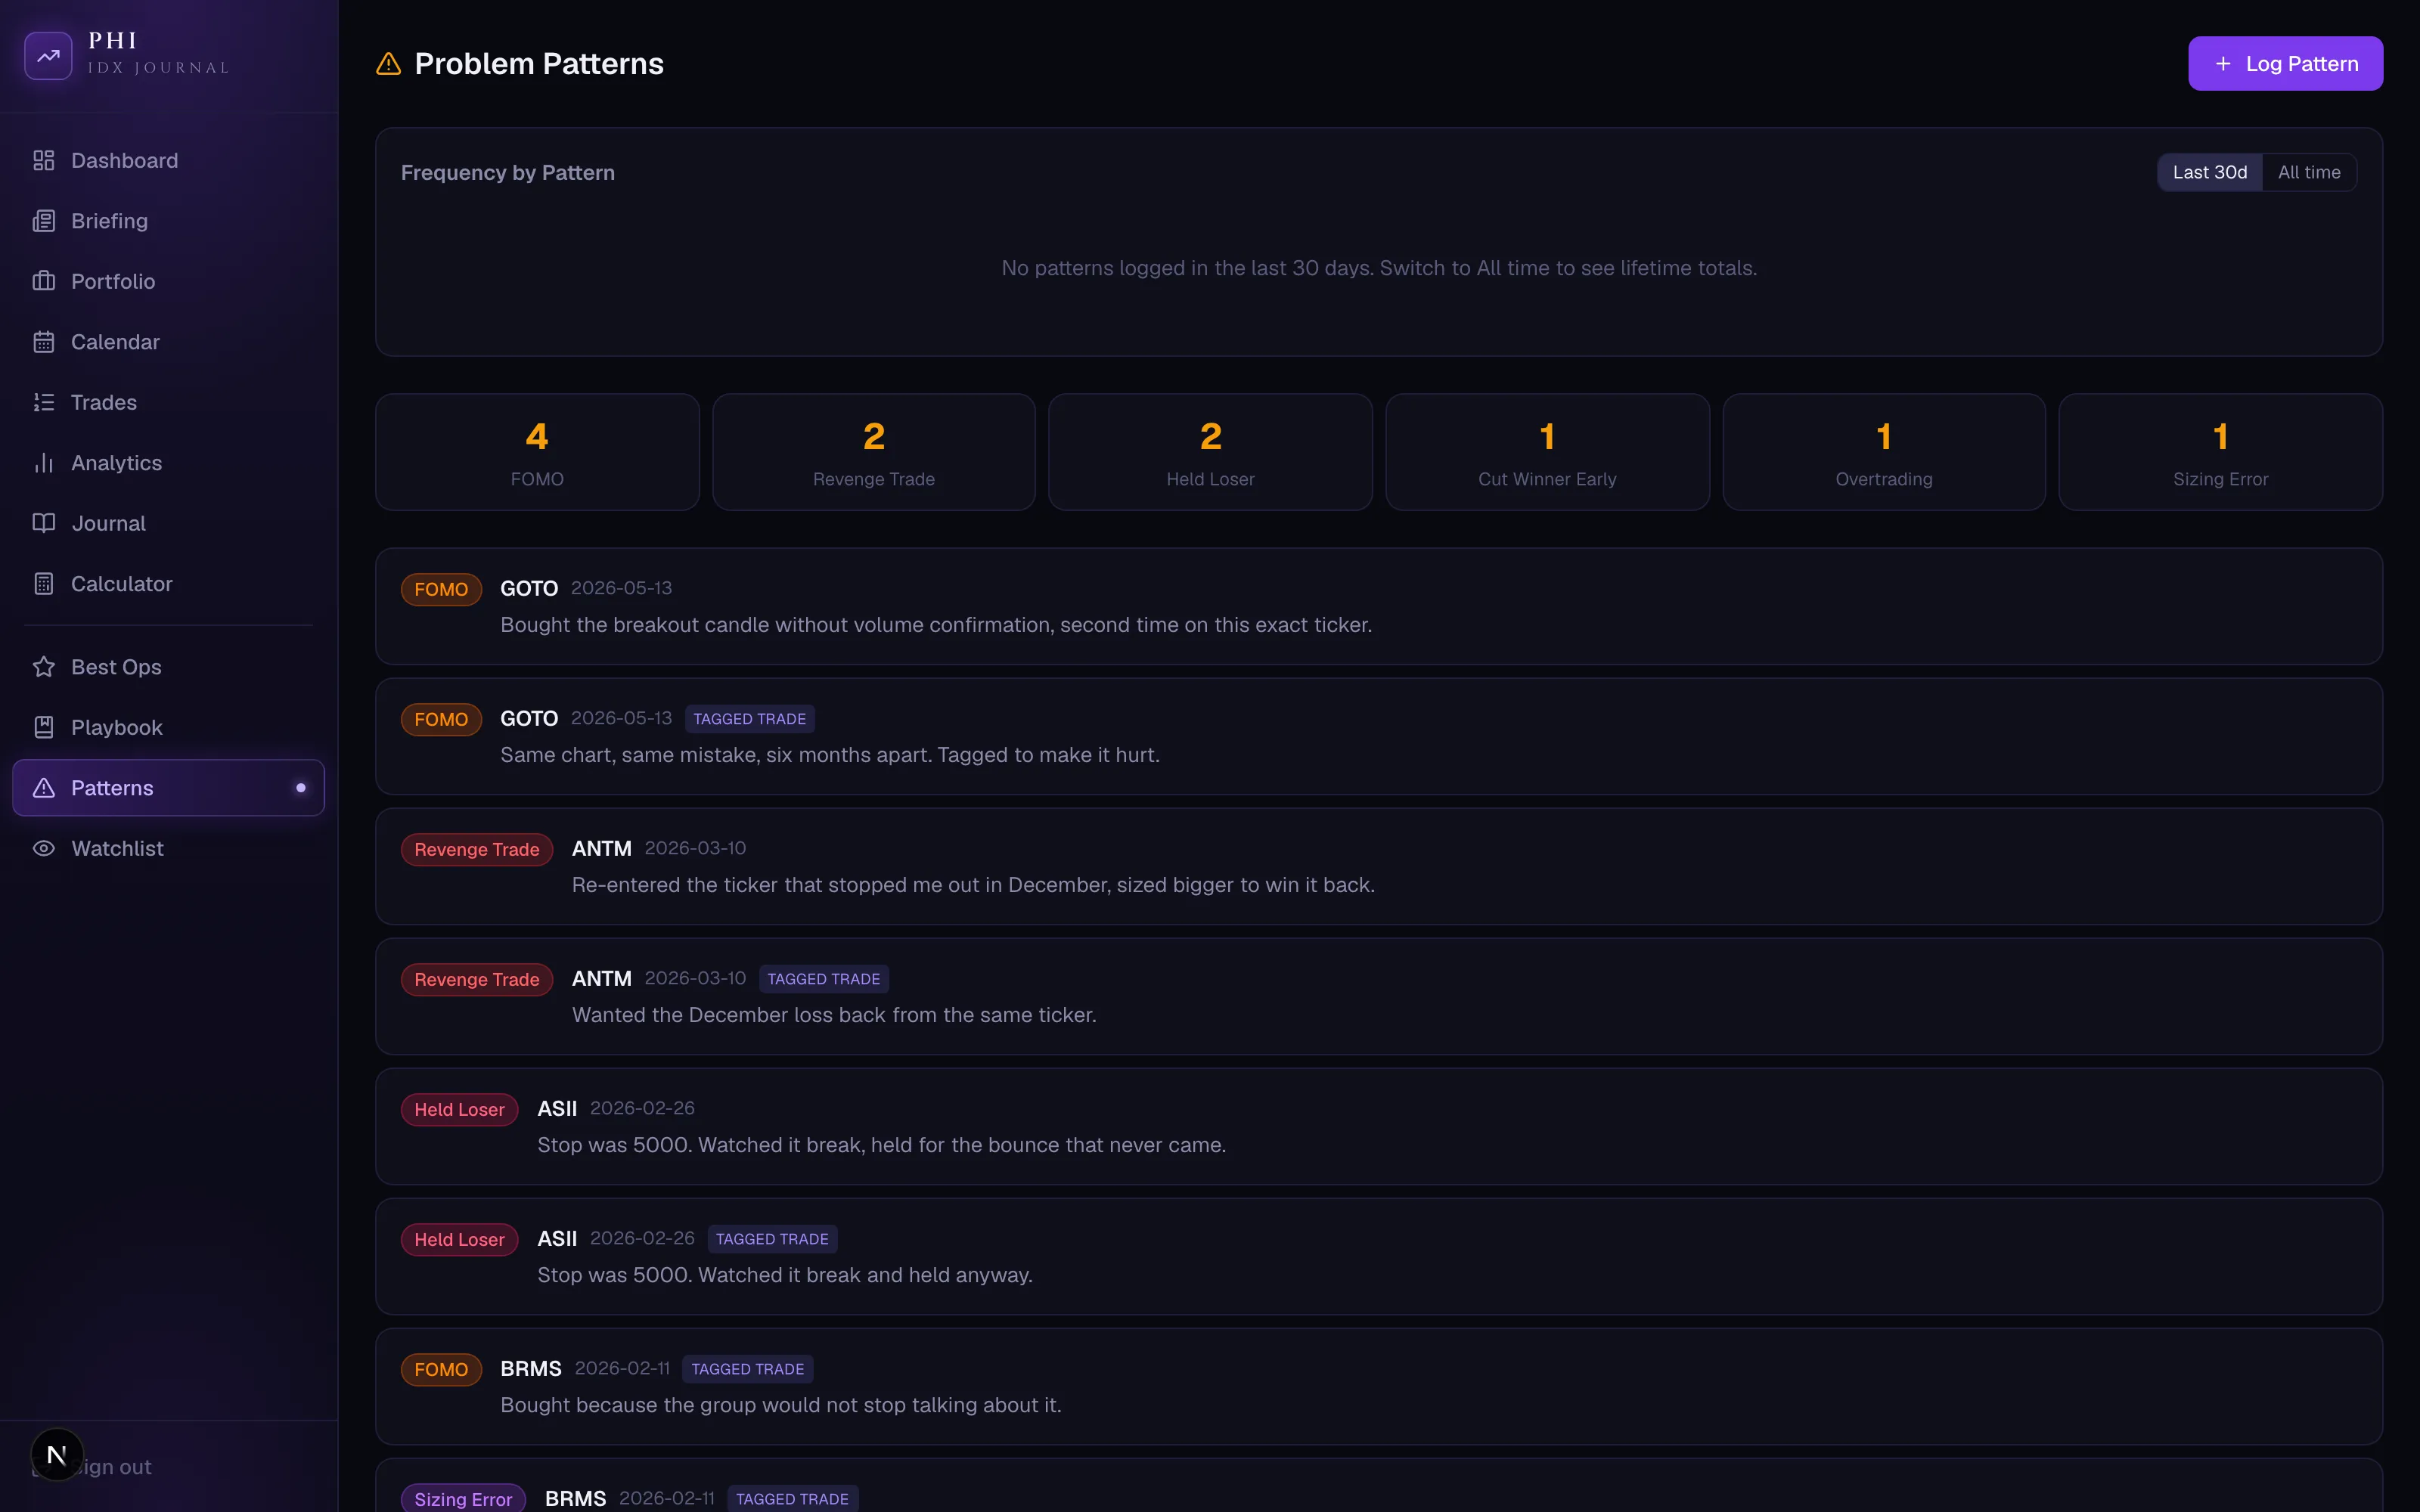
The patterns page is where tagged trades become behavior data. Every FOMO entry, every revenge trade, every stop I did not honor gets logged with what happened and the corrective rule that came out of it.

This is the page that pays for the whole project. Seeing the same mistake on the same ticker six months apart, in writing, changes behavior in a way a red number never did.

StockDashboard problem patterns page with tagged behavioral mistakes, sample data
Problem patterns: the mistakes, counted and named.

Bracketing the trading day

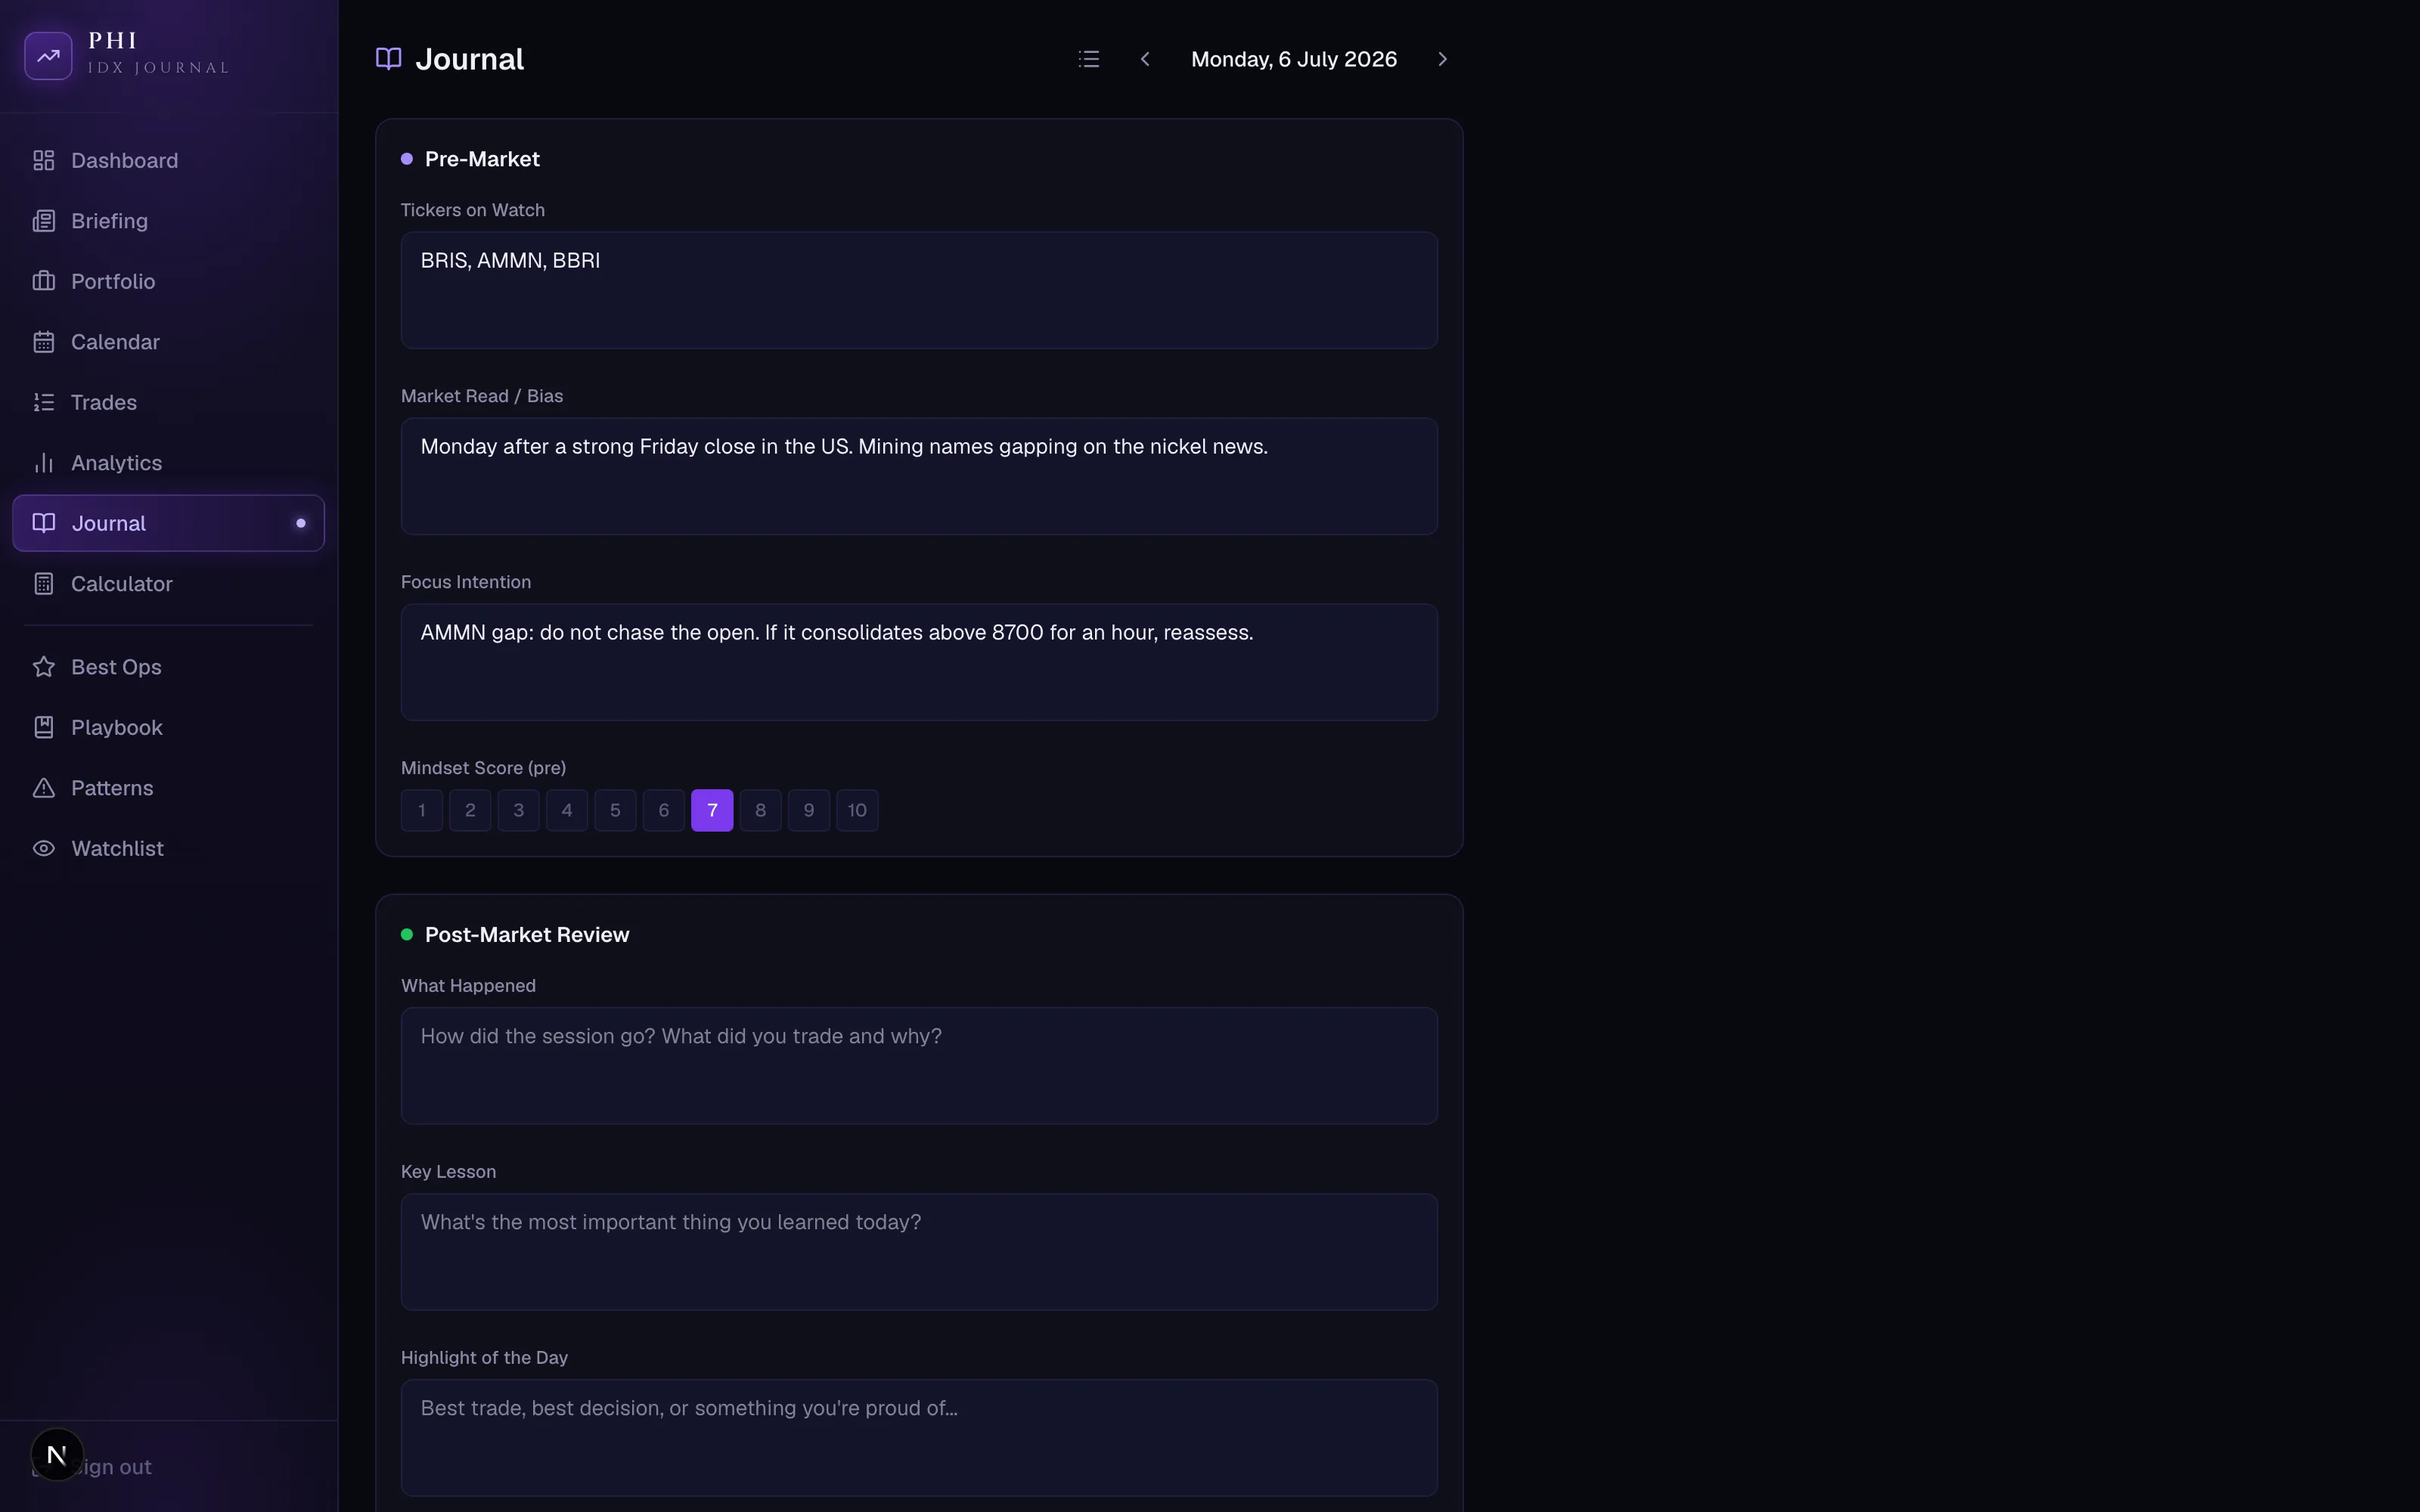
The journal wraps each session: before the open, a market read, a focus intention, and a mindset score; after the close, what actually happened and the lesson. The pre-market plan is written before there is anything to rationalize.

A no-trade day executed as planned counts as execution. The journal is where that gets recorded as a win.

StockDashboard daily journal with pre-market plan and post-market review, sample data
The journal: plan before the open, review after the close.

The market, briefed

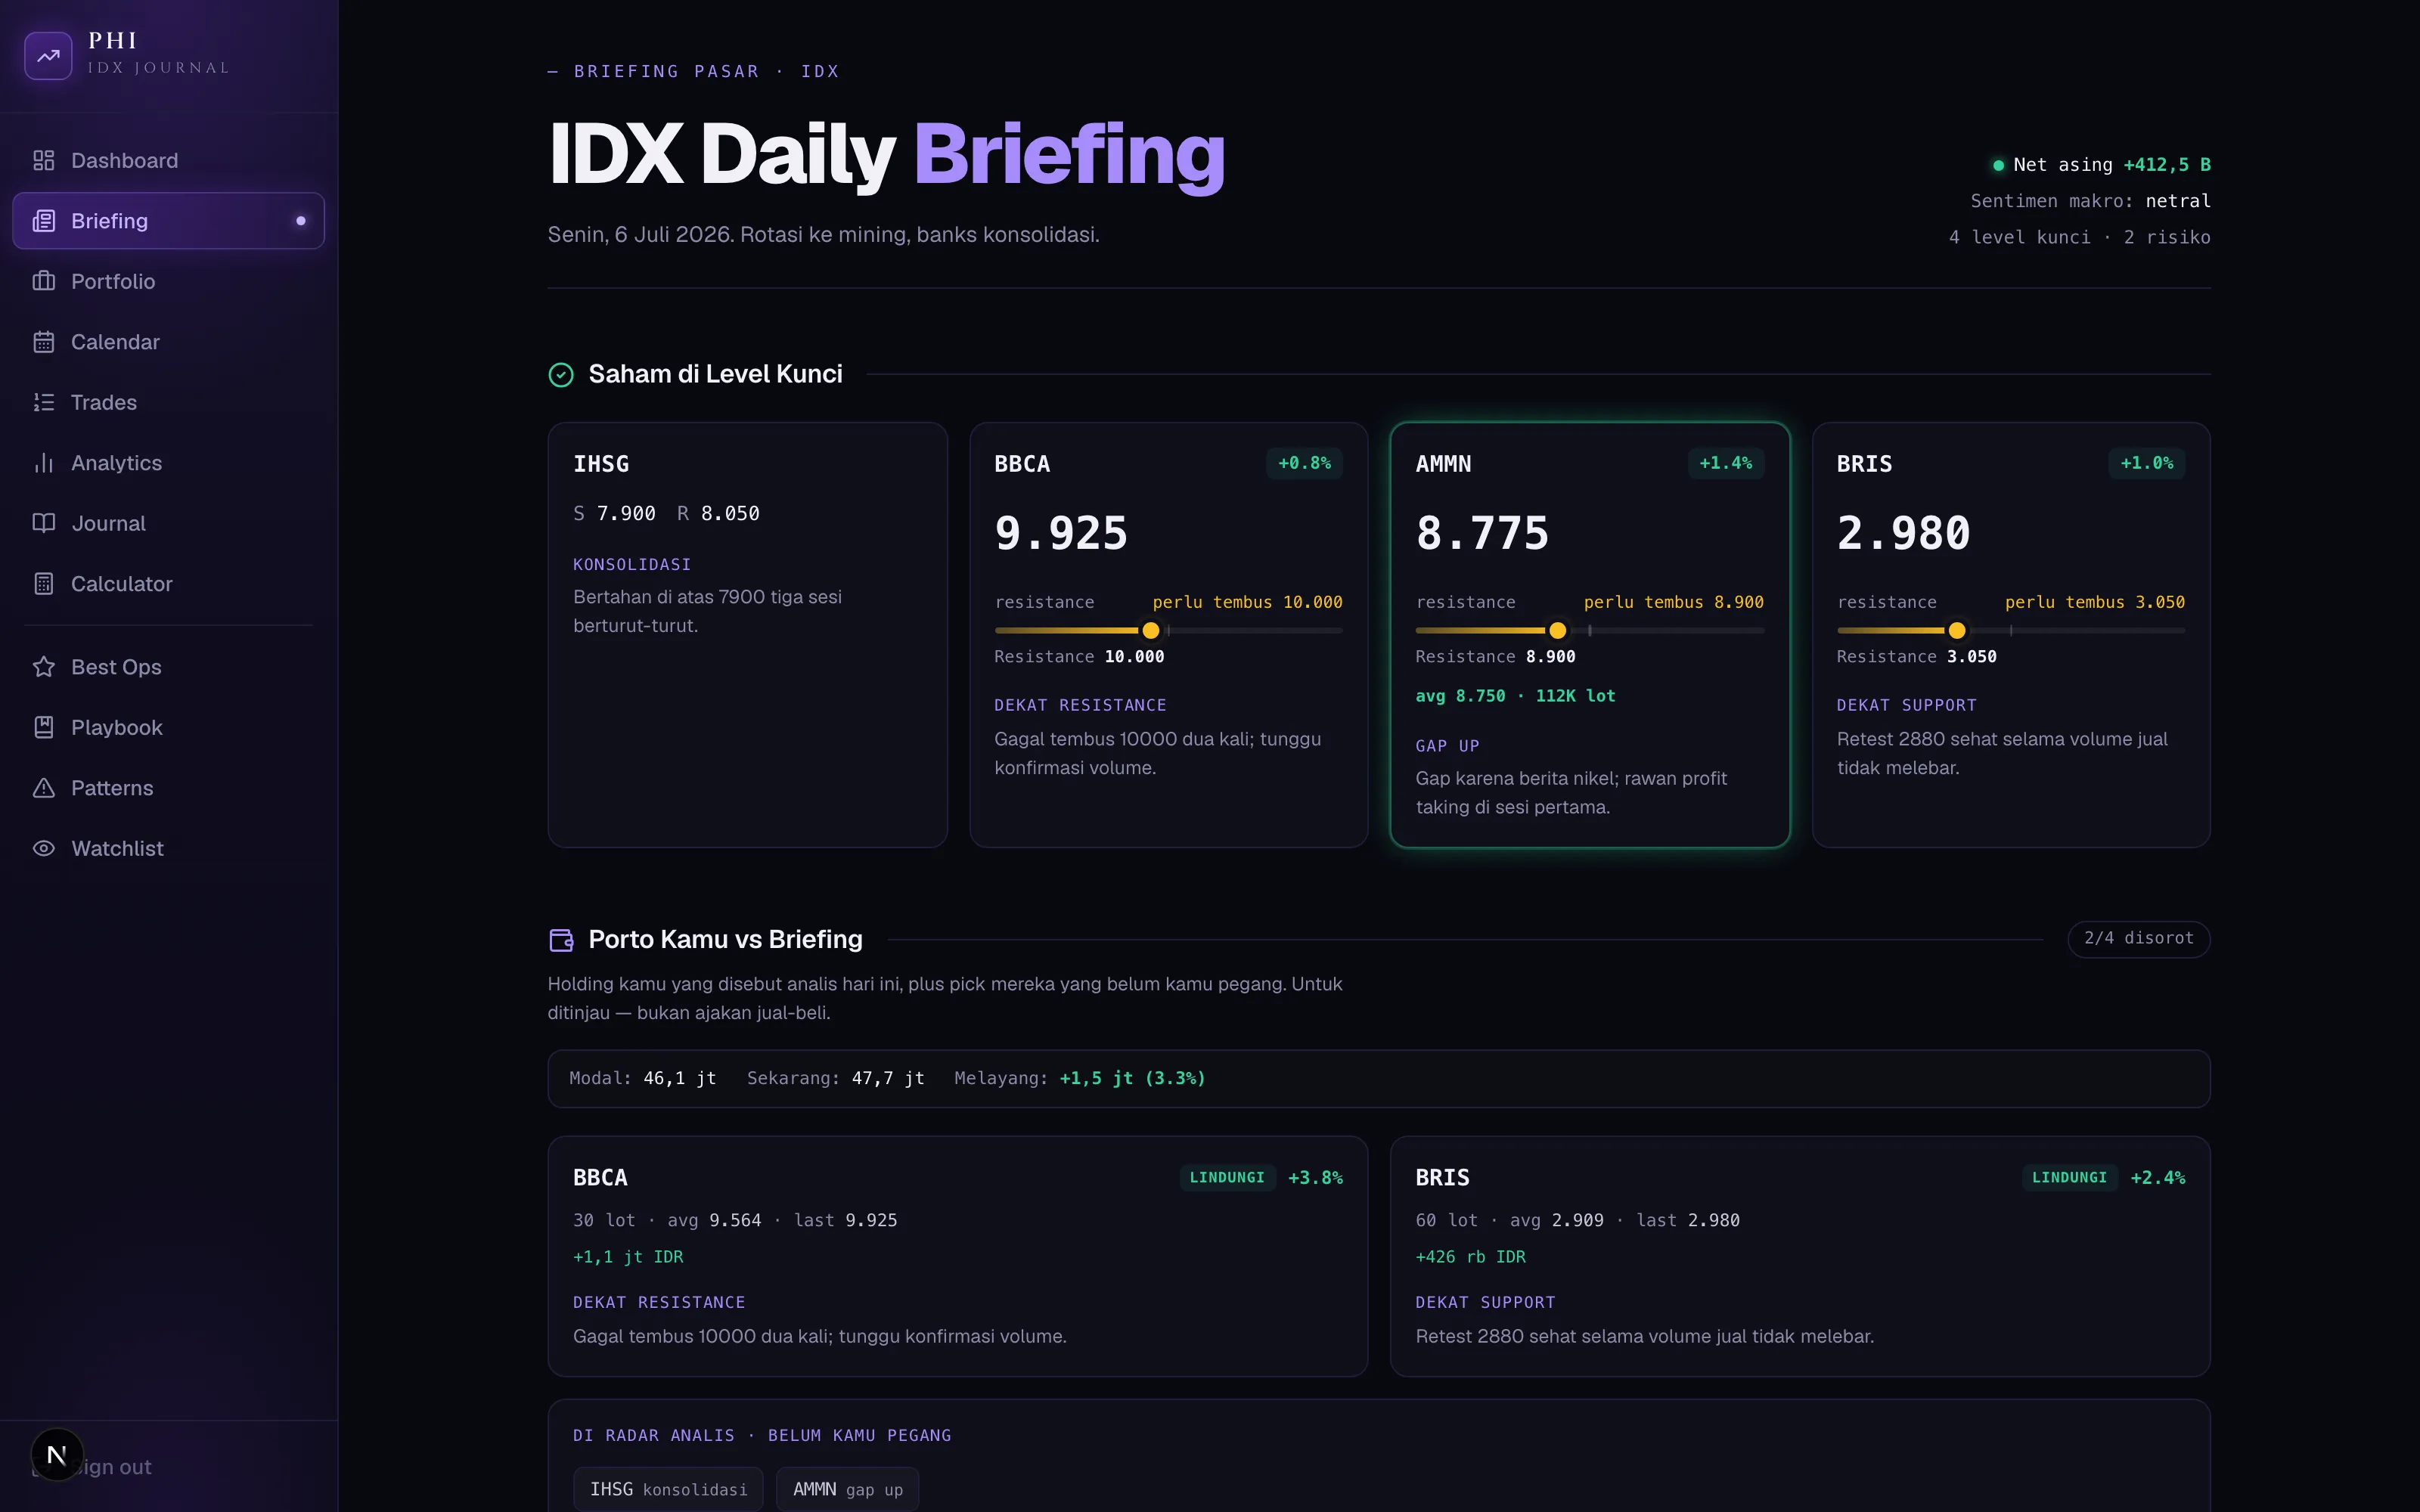
Every trading day I follow an analyst group's discussion of the IDX session. The briefing page turns that day's transcript into a structured read: key levels per ticker, risks, net foreign flow, and the topics that mattered, generated by an LLM against a strict schema so the output is data, not prose.

The section below it crosses the briefing with my own holdings: which of my positions the analysts flagged today, and which of their picks I do not hold. Preparation for tomorrow, on one screen.

StockDashboard daily IDX market briefing with key levels and portfolio cross-reference, sample data
The daily briefing: the analyst discussion, structured, crossed with my portfolio.

The hard parts

Two sources of truth that must not fight

The sheet owns the trades; Supabase owns everything I write about them. The join key is the sheet row number, and the merge happens in the API layer on every read. Getting this boundary right meant the sheet I have trusted for years stays untouched, and the journal can never corrupt the books.

A trade is an interpretation

The sheet stores transactions, not trades. What counts as one completed trade, when a position opened, how long it was held: all of that is derived by replaying the buy and sell history per ticker, tracking when the position goes from zero to open to closed. Splits, partial sells, and re-entries all had to survive that replay.

Making an LLM produce data, not prose

The briefing is generated from a raw discussion transcript, but the page needs structure: tickers, levels, numbers. The generation is constrained to a strict schema and validated before a row is stored, so a bad generation fails loudly instead of rendering garbage. The raw transcript is kept alongside for regeneration and audit.

Notes on the build

Next.js on Vercel, Supabase for the journal layer, Google Sheets left in place as the system of record with sign-in through the same Google account that owns the sheet. The briefing generation runs on the Claude API with structured output validated by a Zod schema before anything is stored.

If you want to talk about this build, or something you want built, say hello on WhatsApp or write to philip.kamdani@gmail.com.

Back to the work